


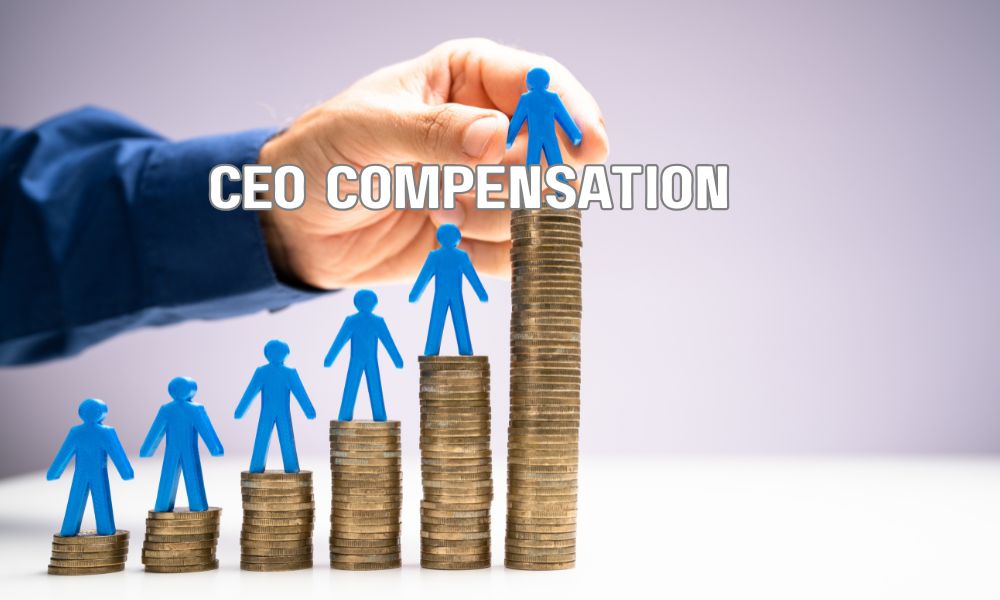
As Global Head of Research & Leadership Advisory at JRG Partners, I have prepared this CEO salary guide for 2026 as a calibration tool for compensation committees and hiring executives. Benchmarks answer where the market is; your mandate answers what you should pay within it. Treat every figure below as a directional input to be adjusted for company size, ownership structure, sector, and geography.
Key Takeaways: CEO Compensation in 2026
- Company scale is the strongest single driver of CEO pay: total compensation rises steeply with revenue, complexity, and public-company status.
- Enterprise value, ownership structure, and the board’s mandate, growth, turnaround, exit preparation, dominate the pricing conversation, with public-company CEO pay driven overwhelmingly by equity and PE-backed CEO economics built around the value-creation plan and exit.
- Base salary is only part of the architecture: incentive design and long-term instruments determine who the package actually attracts.
- Target annual bonuses commonly run 50-100% of base at mid-market companies and 100-150%+ of base at large enterprises, almost always tied to board-approved financial and strategic goals.
- Benchmarks are calibration points, not answers: the specific mandate should shape structure as much as market data does.
What Drives CEO Compensation in 2026
No executive package is more scale-sensitive than the chief executive’s. Enterprise value, ownership structure, and the board’s mandate, growth, turnaround, exit preparation, dominate the pricing conversation, with public-company CEO pay driven overwhelmingly by equity and PE-backed CEO economics built around the value-creation plan and exit. Founder-CEOs are a separate universe where salary is often deliberately suppressed in favor of ownership. Track record prices explicitly at this level: a CEO who has previously delivered the specific outcome the board is buying, an IPO, a successful integration, a category-defining scale-up, commands a premium no benchmark table captures.
CEO Salary Benchmarks by Company Size

The table below presents directional 2026 benchmarks for United States CEO compensation by revenue tier. Base ranges reflect typical market practice; total direct compensation adds the annualized value of long-term incentives, which vary widely by ownership structure.
| Company Revenue | Base Salary Range | Target Total Cash | Typical Total Direct Compensation |
|---|---|---|---|
| Under $25M (venture / early stage) | $300,000 – $400,000 | $400,000 – $700,000 | Cash plus meaningful early-stage equity |
| $25M – $100M | $375,000 – $500,000 | $500,000 – $875,000 | $550,000 – $950,000 |
| $100M – $500M | $475,000 – $650,000 | $650,000 – $1,150,000 | $800,000 – $1.6M |
| $500M – $1B | $575,000 – $750,000 | $775,000 – $1,300,000 | $1.2M – $2.7M |
| $1B – $5B (often public) | $675,000 – $950,000 | $900,000 – $1,650,000 | $2.4M – $6.1M |
| Over $5B (large-cap public) | $875,000 – $1,225,000 | $1,175,000 – $2,150,000 | $5.4M – $13.5M |
Treat these ranges as calibration points. A first-time executive stepping up typically lands in the lower half of a band, while a proven operator with directly relevant experience commands the top of the band or above it.
Benchmarks by Ownership Structure
Public-company CEO packages are equity instruments with a salary attached: at scale, 60-75% of total direct compensation arrives as performance shares and options. PE-backed CEOs typically take moderate cash and 2-8% of the equity depending on enterprise value and entry point, with realized outcomes concentrated at exit. Family-owned enterprises increasingly use long-term cash and phantom-equity plans to compete for professional CEOs without diluting ownership.
Industry Differentials That Persist in 2026
Technology and life sciences pay the largest CEO premiums at equivalent scale, driven by growth expectations and equity culture. Financial services and healthcare systems pay strongly at the upper tiers, industrial and consumer businesses cluster near the median, and nonprofit CEO compensation follows an entirely different, disclosure-governed logic.
Geographic Differentials: Narrower, Not Gone
Geography still moves the number, though less than it once did. Coastal apex markets, New York, the Bay Area, Boston, price 15-25% above national medians; the large Sun Belt and Midwest hubs sit within 5-10% of them; and smaller regional markets run 10-15% below, which lowers local budgets but obliges thoughtful package construction whenever talent must be imported.
Structuring the Package: Beyond the Benchmarks

Package design does work that raw benchmarks cannot. Effective structures keep annual incentives concentrated and auditable, extend long-term vesting across three to four years with performance conditions attached, and frame the whole as one coherent proposition: succeed at this specific mandate and here, concretely, is what it is worth to you. CEO annual bonuses typically target 75-150% of base at meaningful scale, and long-term incentives should carry genuine performance conditions: relative shareholder return, EBITDA growth, or exit-value hurdles rather than tenure alone. Severance and change-of-control terms belong at offer stage, and sign-on instruments should solve a candidate’s specific transition math rather than serving as blunt sweeteners.
Common Pricing Mistakes to Avoid
Most compensation failures are unforced. Employers price against history instead of the current mandate, compare their base against the candidate’s total package, defer incentive design until it must be improvised under deadline, and import benchmarks from markets or scales that do not match their own. A prepared committee eliminates all four before the first candidate conversation.
How to Use These Benchmarks in a Live Search
The sequence we recommend to clients is straightforward. Define the mandate before pricing the role. Benchmark against role scope and company trajectory, not the departing incumbent’s legacy package. Set the approved range before finalist interviews so decision speed never waits on a committee cycle. Pressure-test the package against what your two most realistic competitor employers would offer the same candidate. Then interview against the money to verify the operator you are pricing is the operator you are getting. Our companion guide, 25 Interview Questions to Ask When Hiring a CEO, is built for exactly that verification step.
The Bottom Line for Boards and CEOs
Compensation in 2026 rewards preparation. Employers who anchor to credible market data, structure incentives around the actual mandate, and move decisively through offer stage consistently land their first-choice candidates without overpaying. Treat this CEO salary guide as your calibration baseline, then let your mandate, ownership structure, and market determine the final architecture.
Frequently Asked Questions
- Q: What is the average CEO salary in the United States in 2026?
- A: There is no single meaningful average because scale dominates the answer. Mid-market CEOs at $100M-$500M revenue companies typically earn base salaries in the $475,000-$650,000 range, with total direct compensation well above that once incentives and long-term instruments are included.
- Q: What bonus percentage is standard for a CEO?
- A: Target annual bonuses commonly run 50-100% of base at mid-market companies and 100-150%+ of base at large enterprises, almost always tied to board-approved financial and strategic goals.
- Q: How much equity should a CEO receive?
- A: PE-backed CEOs commonly receive 2-8% of equity value in options or profits interests; venture-backed CEOs hired from outside typically receive 3-6% at early stage, declining with company maturity; public-company grants are sized in dollar value, frequently 3-6x base salary annually at scale.
- Q: How does CEO pay compare with COO pay?
- A: The CEO premium over the COO typically runs 30-60% on total direct compensation at the same company, widening with scale as equity grants diverge. Where a COO is the designated successor, boards often compress the gap deliberately as part of the transition plan.
- Q: Should we pay a first-time CEO less than the benchmark range?
- A: Use the lower half of the band, not a discount beneath it. Underpricing a first-time executive selects for candidates the market has not validated and creates a retention problem the moment the market does.
- Q: How often should CEO compensation be re-benchmarked?
- A: Review annually as part of the incentive cycle, and re-benchmark on any step-change in scope, M&A, rapid scaling, new market entry, because compensation that lags a growing mandate is a resignation letter in draft.

Tanya Gallardo
Managing Director, Executive Search & AI Talent Strategy
Tanya Gallardo is the Managing Director of Executive Search & AI Talent Strategy at JRG Partners, leading C-suite and Board engagements across key growth sectors including Technology, Financial Services, and Manufacturing.
With over 18 years of experience specializing in disruptive technology leadership, Tanya is recognized as a leading authority on talent architecture for future-focused executive roles, such as the Chief AI Officer (CAIO) and Chief Digital Officer (CDO). Her expertise lies in accurately assessing the cultural fit and technical depth required to ensure a high return on investment (ROI) for critical leadership appointments.
Prior to her role at JRG Partners, Tanya held senior roles directing global talent acquisition strategies at a major publicly-traded technology firm, advising on organizational design and succession planning for emerging executive functions. She is a recognized speaker and contributor to industry events, sharing data-driven insights on executive compensation, leadership development, and the measurable business impact of C-suite talent.
